
Pharos
Uptime monitoring, a public status page and incident handling in a single binary (Go + embedded SQLite), started with one command. Two things set it apart: incident operations that live in Discord, and uptime that does not round in its own favor. Open source, self-hosted.
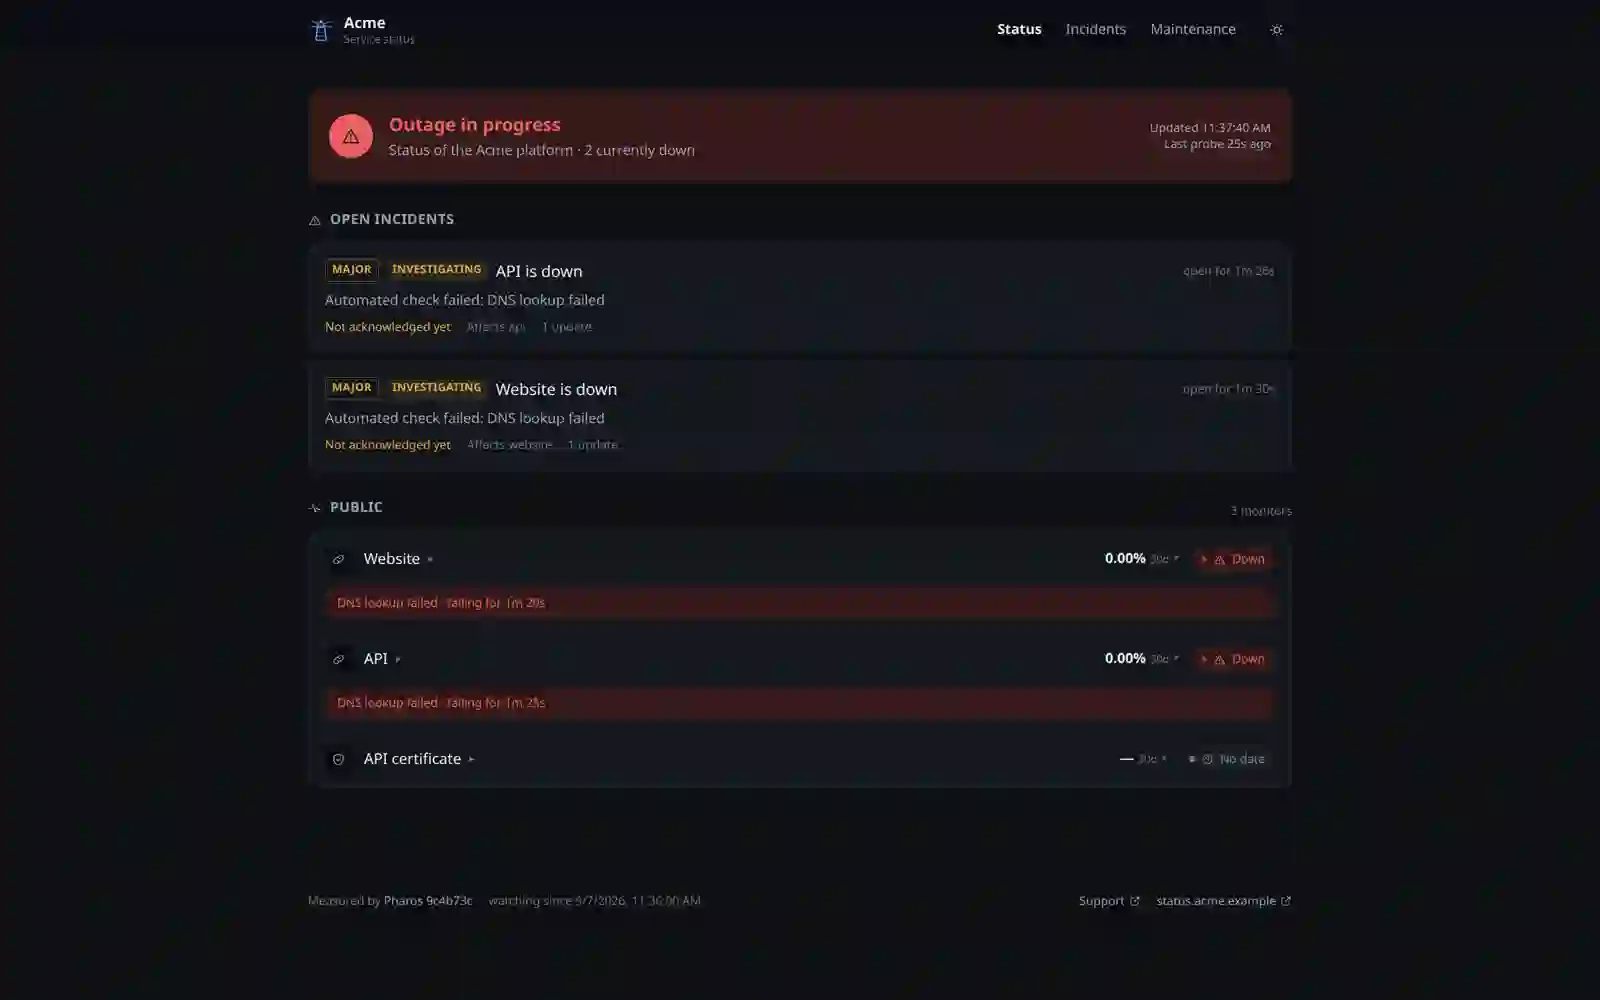
Pharos is uptime monitoring, a public status page and incident handling wired into a single Go binary with embedded SQLite. You start it with one command, host it yourself, and the uptime does not round up in its own favor: time without observation is not "up", it is "unknown". You run incidents from Discord, the code is open, and the number on the status page means exactly what it says.
Overview
Status pages share one ugly trait: almost all of them lie in their own favor. When a probe stops polling a service, because the monitoring itself went down or retention ran out, most tools simply do not count that gap toward the stats. The result is a chart showing 100 percent availability across a window in which nobody measured anything. Add maintenance windows that magically never dent the bar, and suddenly you have a panel that looks great and means nothing.
We built Pharos the other way around. It is a tool you start with a single command, keep on your own server, and can actually trust, because when it does not know, it says so. It is not another cloud dashboard with a subscription and someone else's retention, but one file you copy next to the rest of your services and run. The rest of this case study is the story of how one decision in the availability formula changes the character of the whole product.
Silence is not availability
Classic monitoring knows two states: the service is up or it is down. That is convenient until you ask what happens when the monitoring is not looking at all. Because then the tool has to do something with that time, and the default choice almost always falls into the same trap: it treats silence as success and quietly folds it into the "up" bar. That is how you get the absurd 100 percent for a month in which half the data never existed.
Here every stretch of a service's life has three states, not two. Up, down and unobserved. That third one is the whole point: it is time when we collected no data, so we have no right to claim things were fine. Instead of adding it to the top, we show it plainly as its own slice of the window. Maintenance windows get marked, but they do not erase outages from the history, they only separate what was planned from what was unexpected.
Most status pages compute availability as "up" time over "up plus down" time. Pharos computes it as "up" time over time actually observed, and parks the un-probed stretch separately as "unknown". It is a one-line difference in the formula and the whole difference in how much you trust the number.
How we count honest uptime
The three-state split sounds minor until you see it on a concrete window. Take a day where a service was up most of the time, went down for a moment, and for a stretch nobody probed it because the monitoring machine restarted itself. A naive counter sums the up time with the unobserved time and spits out a flattering, high percentage. An honest counter shows less and adds that for a while it knew nothing.
What a window is really made of
The same day, two counters
The same day, run through two different formulas, yields two completely different numbers. And this is not cosmetics: it is the difference between a report a client can trust and a report that just looks good in a meeting. We picked the less flattering one, because it is the only one that means anything.
The same day, two counters (percent available)
One file you stand up with a command
The biggest practical problem with status tools is how much you have to stand up around them before they show anything. A separate database, a queue, a worker, a panel, a reverse proxy. Pharos goes the opposite way: all the monitoring, history, the status page and incident handling sit in one static Go executable, and the data lives in an embedded SQLite. There is no separate database to stand up and babysit, no runtime to install. You copy the binary, run it, and work.
That simplicity is not cutting features, it is a deliberate cut of the maintenance surface. The fewer moving parts, the fewer things that can break at three in the morning. One deploy, one port, one log to read when something goes wrong.
Stack
| Layer | Choice | Why |
|---|---|---|
| Core | Go, one static executable | zero runtime dependencies, you copy it and run it |
| Data | SQLite embedded in the binary | no separate database to stand up and babysit |
| Probes | background HTTP and TCP | simple checks that cover most services |
| Notifications | Discord webhooks | the team is already there, no extra tool |
| Status page | served from the same process | one deploy, one port, one log |
Background probes and a stream of results
Under an honest number there has to be an honest data source. Pharos polls your services on a fixed interval over HTTP and TCP, and records every single result together with its response time and a timestamp. We do not average anything on the fly and we do not overwrite history, because it is exactly from that raw stream of samples that the three states are later built. If there is no sample for some interval, that interval is unobserved by definition, not by default.
polls your services over HTTP and TCP on a fixed interval and records every result with its response time.
each sample sits separately, with its own timestamp, instead of being averaged away immediately.
builds history from three states and never treats silence as success.
serves a public status page with a readable history, the kind a client understands without a translator.
when a service state changes, a notification lands on Discord, right where the team works.
Notice two things in this snippet. Unobserved time is skipped in the denominator, not added to the top. And when there was no observation at all, the function returns NaN instead of a fake 100 percent, because no data is no data, not a success.
Incidents where the team already is
The classic outage scenario looks like this: something breaks, someone notices, and the hopping begins between the monitoring panel, the chat and the status page. Three windows, three versions of the truth, and a good chance the public status drifts from what the team actually knows. Pharos cuts that to one place. You open and run an incident from Discord, and the public status page is just a reflection of what the team is writing anyway.
There is no second tool to learn and no risk of the status going its own way, because it is the same reality seen from two sides. Opening, updates and closing all happen where you already sit, and the page refreshes itself.
A number you can trust
Honest monitoring is not the one that always shows green. It is the one that admits it was not looking for a moment.
What came out is a tool you can drop onto a small machine next to the rest of your services and then stop thinking about. One file, an embedded database, one port. The number on the status page means exactly what it says, and when monitoring does not know something, it does not pretend to. For the client watching that page, that is the difference between trust and a billboard.
If your status page has shown a neat 99.99 percent for years, it is worth checking whether things are really that good or whether nobody is counting the silence. An honest counter almost always shows less than the one we got used to, and that is exactly why it is worth something.
The code is open, so you can read that whole formula yourself rather than take our word for it. That is probably the most honest thing a tool for honestly counting availability can say about itself.
More projects
More work from the same category - see how we tackle similar challenges.
Have a similar project?
Get in touch - a quote is free and comes back within an hour.